


The previous sections considered the theoretical explanations of international trade and national, regional, and international attempts to regulate it. In this section we will consider the amount, distribution, and importance of international trade.
Figure 7.5 provides data on world trade (the total of imports and exports, which are listed separately in the exhibit) for the years 1985, 1986, and 1987. As the exhibit shows, in 1985 the industrialized countries accounted for over 74% of this trade, and the developing countries did not quite reach the 22% mark. Furthermore, the industrialized countries' share of world trade increased continuously over the three years shown; the developing countries' share declined from 25% in 1985 to 21.46% in 1987. Even though world trade increased by 36.43% for exports and 32.38% for imports over the three years, the developing countries enjoyed very little of this increase (18.54% and 11.31%, respectively).
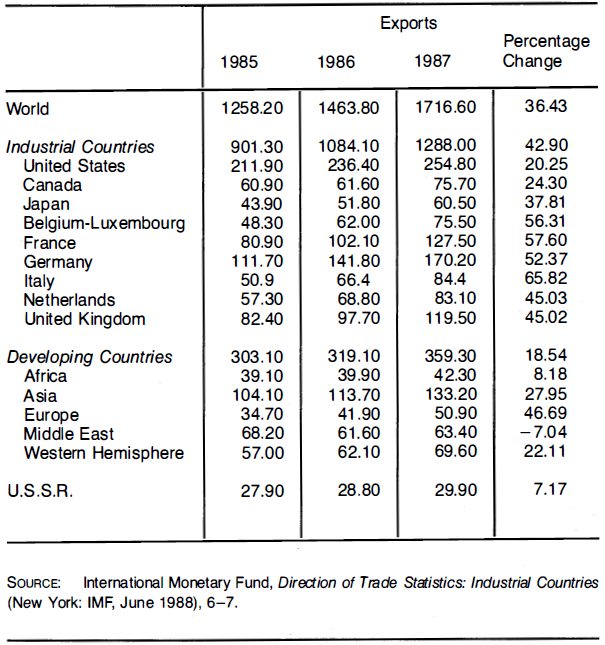
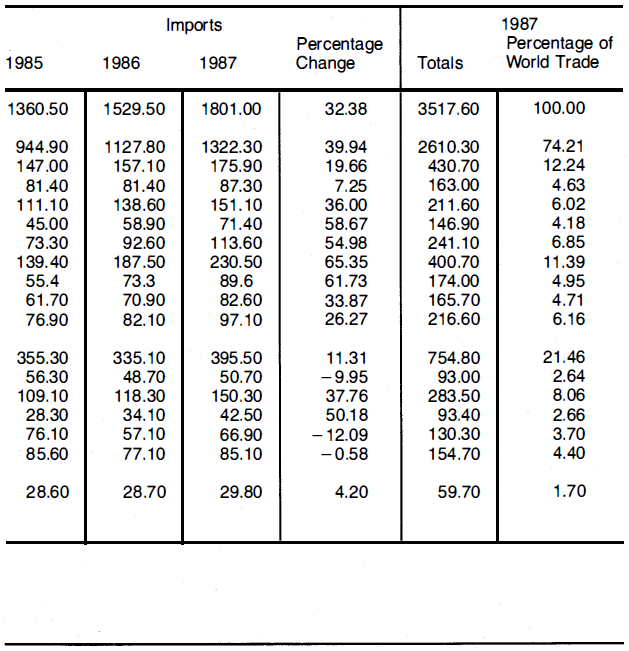
Even within the developed world the growth in international trade was not shared equally. The largest increase in trade over the years shown was in Italy—a whopping 65.82% increase in exports (almost twice the world increase).
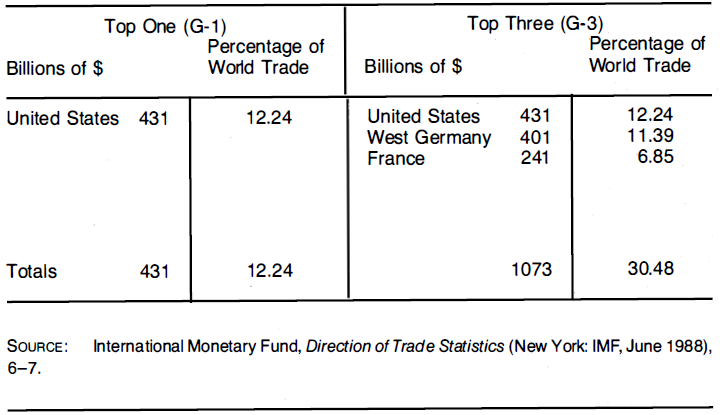
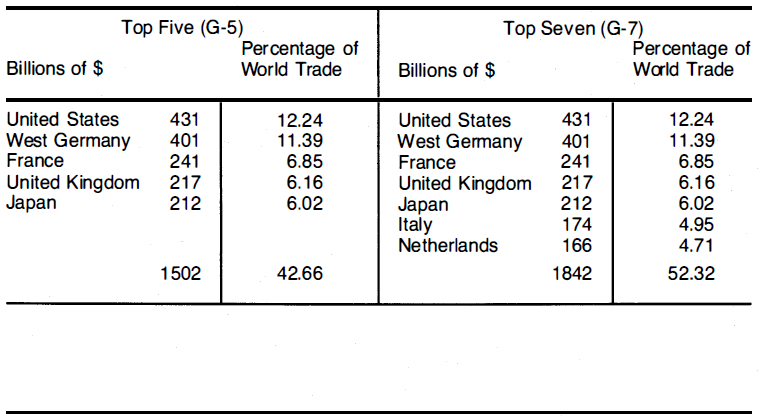
It is customary to report on world trade in terms of progressively larger groups labeled G-1 through G-7. Group 1, the single largest trader, is the United States, which accounted in 1987 for 12.24% of the world's trade. The three largest international trade powers, the United States, West Germany, and France, accounted in 1987 for over 30% of the world's trade. Group 5, the most widely known group, accounted for over 40% of 1987 world trade, and G-7 traded more than 50% of the world's goods and services. (See Figure 7.6.)
- 1890 reads
