


Life tables provide important information about the life history of an organism and the life expectancy of individuals at each age. They are modeled after actuarial tables used by the insurance industry for estimating human life expectancy. Life tables may include the probability of each age group dying before their next birthday, the percentage of surviving individuals dying at a particular age interval (their mortality rate, and their life expectancy at each interval. An example of a life table is shown in Table 19.1 from a study of Dall mountain sheep, a species native to northwestern North America. Notice that the population is divided into age intervals (column A). The mortality rate (per 1000) shown in column D is based on the number of individuals dying during the age interval (column B), divided by the number of individuals surviving at the beginning of the interval (Column C) multiplied by 1000.

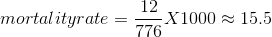
For example, between ages three and four, 12 individuals die out of the 776 that were remaining from the original 1000 sheep. This number is then multiplied by 1000 to give the mortality rate per thousand.
As can be seen from the mortality rate data (column D), a high death rate occurred when the sheep were between six months and a year old, and then increased even more from 8 to 12 years old, after which there were few survivors. The data indicate that if a sheep in this population were to survive to age one, it could be expected to live another 7.7 years on average, as shown by the life-expectancy numbers in column E.
| Life Table of Dall Mountain Sheep 1 | ||||
| A | B | C | D | E |
| Age interval (years) | Number dying in age interval out of 1000 born | Number surviving at beginning of age interval out of 1000 born | Mortality rate per 1000 alive at beginning of age interval | Life expectancy or mean lifetime remaining to those attaining age interval |
| 0-0.5 | 54 | 1000 | 54.0 | 7.06 |
| 0.5-1 | 145 | 946 | 153.3 | - |
| 1-2 | 12 | 801 | 15.0 | 7.7 |
| 2-3 | 13 | 789 | 16.5 | 6.8 |
| 3-4 | 12 | 776 | 15.5 | 5.9 |
| 4-5 | 30 | 764 | 39.3 | 5.0 |
| 5-6 | 46 | 734 | 62.7 | 4.2 |
| 6-7 | 48 | 688 | 69.8 | 3.4 |
| 7-8 | 69 | 640 | 107.8 | 2.6 |
| 8-9 | 132 | 571 | 231.2 | 1.9 |
| 9-10 | 187 | 439 | 426.0 | 1.3 |
| 10-11 | 156 | 252 | 619.0 | 0.9 |
| 11-12 | 90 | 96 | 937.5 | 0.6 |
| 12-13 | 3 | 6 | 500.0 | 1.2 |
| 13-14 | 3 | 3 | 1000 | 0.7 |
- 2675 reads
