


The inventory record card transactions using weighted average costing are detailed in Figure 6.9. For consistency, all weighted averagecalculations will be rounded to two decimal places. When a perpetual inventory system is used, the weighted average is calculated each time a purchase is made. For example, after the June 7 purchase, the balance in inventory is 2 units with a total cost of $5.00 (1 unit at $2.00 + 1 unit at $3.00) resulting in an average cost per unit of $2.50 ($5.00 ÷ 2 units = $2.50). When a sale occurs, the cost of the sale is based on the most recent average cost per unit. For example, the cost of the sale on June 3 uses the $1.00 average cost per unit from June 1 while the cost of the sale on June 8 uses the $2.50 average cost per unit from June 7.
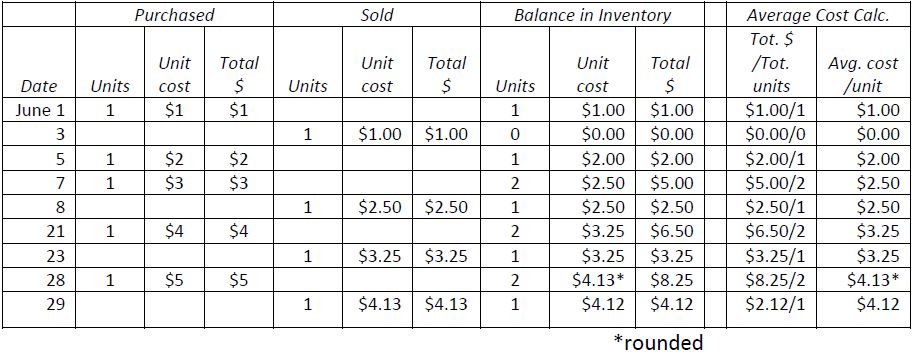
A common error made by students when applying weighted average occurs when the unit costs are rounded. For example, on June 28, the average cost per unit is rounded to $4.13 ($8.25 ÷ 2 units = $4.125/unit rounded to $4.13). On June 29, the cost of the unit sold is $4.13, the June 28 average cost per unit. Care must be taken to recognize that the total remaining balance in inventory after the June 29 sale is $4.12, calculated as the June 28 ending inventory total dollar amount of $8.25 less the June 29 total cost of goods sold of $4.13. Students will often incorrectly use the average cost per unit, in this case $4.13, to calculate the ending inventory balance. This produces an incorrect result. The cost of goods sold plus the balance in inventory must equal the goods available for sale ($4.12 + $4.13 = $8.25).
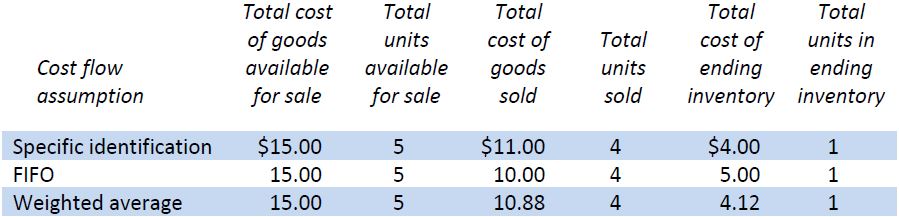
Figure 6.10 compares the results of the three cost flow methods. Goods available for sale, units sold, and units in ending inventory are the same regardless of which method is used. Because each cost flow method allocates the cost of goods available for sale in a particular way, the cost of goods sold and ending inventory values are different for each method.
- 35110 reads
