


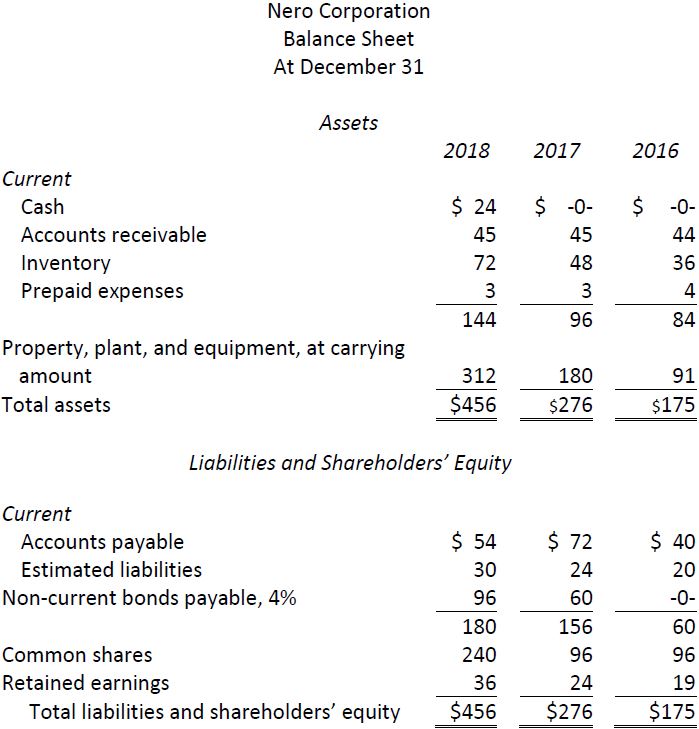
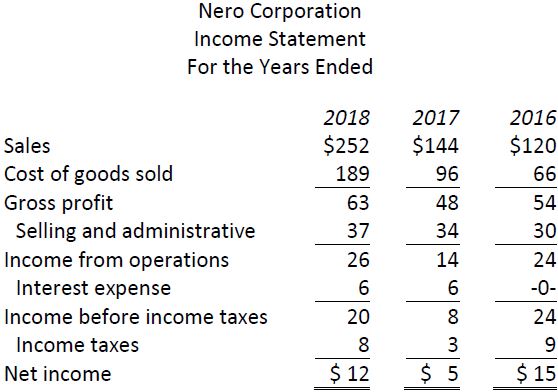
The following are condensed comparative financial statements of Nero Corporation for the three years ended December 31, 2016, 2017, and 2018.
The following additional information is available:
|
a. |
All sales are on credit; credit terms are net 60 days after invoice date. |
|
b. |
Twenty common shares were outstanding in years 2016 and 2017. On April 1, 2018, an additional 30 common shares were issued for $144 cash in total. |
|
c. |
The accounts receivable balance at January 1, 2016 was $19. |
|
d. |
The inventory balance at January 1, 2016 was $24. |
|
e. |
The net capital assets balance at January 1, 2016 was $91. |
|
f. |
The total assets balance at January 1, 2016 was $165. |
|
g. |
The total shareholders’ equity balance at January 1, 2016 was $101. |
|
h. |
Dividends of $8 were declared in 2016. No dividends were declared in 2017 and 2018. |
|
i. |
Interest has been paid on the bonds each year and is included in interest expense. |
|
Required: |
||||
|
1. |
From the above information, calculate the following for each of the three years: |
|||
|
a. |
Liquidity |
|||
|
Current ratio Acid-test ratio Accounts receivable collection period Number of days of sales in inventory Revenue operating cycle. |
||||
|
b. |
Profitability |
|||
|
Gross profit ratio Net profit ratio Return on total assets Return on shareholders’ equity |
||||
|
c. |
Leverage |
|||
|
Debt to shareholders’ equity ratio Times interest earned |
||||
|
d. |
Market measures |
|||
|
Earnings per share |
||||
|
2. |
What conclusions can be drawn? |
|||
|
3. |
(Appendix) Restate the financial statements for all three years to facilitate Scott formula analysis. |
|||
|
4. |
(Appendix) Calculate the Scott formula for the three years and comment on the results. |
|||
- 2541 reads
