


| LO1 - Describe ratio analysis, and explain how liquidity, profitability, leverage, and market ratios are used to analyze and compare financial statements. |
A common way to evaluate financial statements is through ratio analysis. A ratio is a relationship between two numbers of the same kind. For example, if there are two apples and three oranges, the ratio of the number of oranges to the number of apples is 2:3 (read as “two to three”). A financial ratio is a measure of the relative magnitude of two selected numerical values taken from a company’s financial statements. For instance, the gross profit percentage studied in in an earlier chapter and also known as the gross profit ratio, expresses the numerical relationship between gross profit and sales. If a company has a gross profit ratio of 0.25:1, this means that for every $1 of sales, the company earns, on average, $0.25 to cover expenses other than cost of goods sold. Another way of stating this is to say that the gross profit ratio is 25%. 1
Financial ratios are effective tools for measuring the financial performance of a company because they provide a common basis for evaluation—for instance, the amount of gross profit generated by each dollar of sales for different companies. Numbers that appear on financial statements need to be evaluated in context. It is their relationship to other numbers and the relative changes of these numbers that provide some insight into the financial health of a business. One of the main purposes of ratio analysis is to highlight areas that require further analysis and investigation. Ratio analysis alone will not provide a definitive financial evaluation. It is used as one analytic tool, which, when combined with informed judgment, offers insight into the financial performance of a business.
For example, one business may have a completely different product mix than another company even though both operate in the same broad industry. To determine how well one company is doing relative to others, or to identify whether key indicators are changing, ratios are often compared to industry averages. To determine trends in one company’s performance, ratios are often compared to past years’ ratios of the same company.
To perform a comprehensive analysis, qualitative information about the company as well as ratios should be considered. For example, although a business may have sold hundreds of refrigerators last year and all of the key financial indicators suggest growth, qualitative information from trade publications and consumer reports may indicate that the trend will be towards refrigerators using significantly different technologies in the next few years. If the company does not have the capacity or necessary equipment to produce these new appliances, the present positive financial indicators may not accurately reflect the likely future financial performance of the company.
An examination of qualitative factors provides valuable insights and contributes to the comprehensive analysis of a company. An important source of qualitative information is also found in the notes to the financial statements, which are an integral part of the company’s financial statements.
In this chapter, financial ratios will be used to provide insights into the financial performance of Big Dog Carworks Corp. (BDCC). The ratios will focus on financial information contained within the income statement, statement of changes in equity, and balance sheet of BDCC for the three years 2019, 2020, and 2021. This information is shown below. Note that figures in these statements are reported in thousands of dollars (000s).
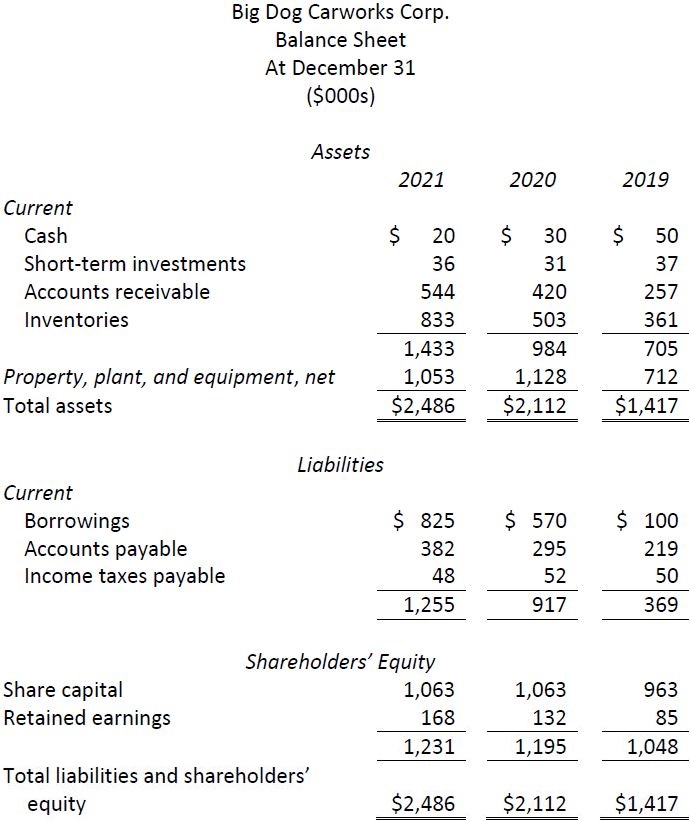
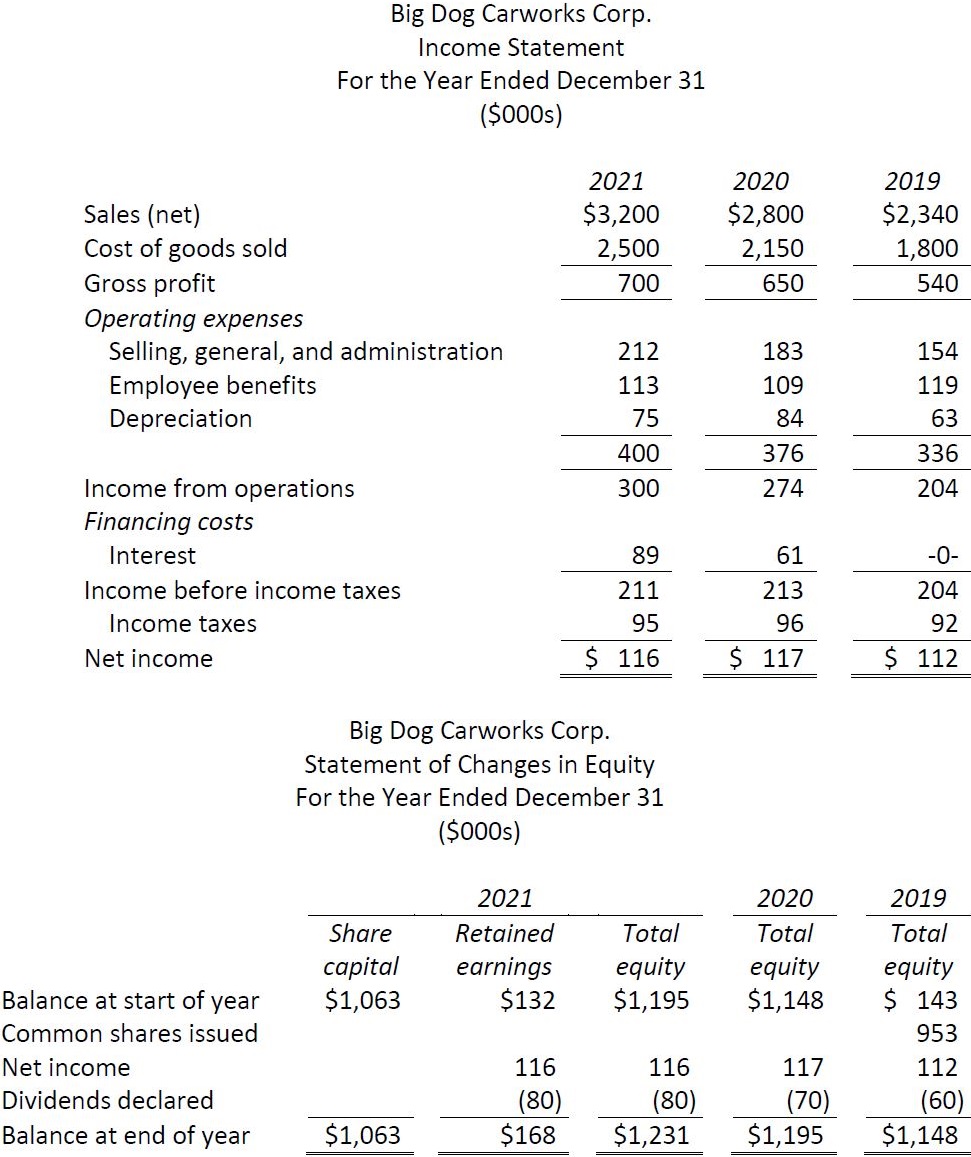
Assume that 100,000 common shares are outstanding at the end of 2019, 2020, and 2021.
There are four major types of financial ratios: a) liquidity ratios that measure the ability of a corporation to satisfy demands for cash as they arise in the near-term (such as payment of current liabilities); b)profitability ratios that measure various levels of return on sales, total assets employed, and shareholder investment; c) leverage ratios that measure the financial structure of a corporation, its amount of relative debt, and its ability to cover interest expense; and d) market ratios that measure financial returns to shareholders, and perceptions of the stock market about the corporation’s value.
- 8063 reads
