


As noted above, the other useful feature of the Scott formula is its analysis of return on leveraging (ROL), and the resultant effects on return on shareholders’ equity. Recall that leverage is the return generated by assets in excess of the cost of borrowing money to finance these assets (after-tax interest expense). An example of leveraging was illustrated in Figure 13.8. A further refinement of leverage is the effect of financial structure. This is indicated by the debt to shareholders’ equity ratio. In Figure 13.8, the debt to shareholders’ equity ratio is 1:1 for company B ($200,000/200,000). (We can ignore analysis of leverage for company A, as it has no liabilities.) Now assume the same information for company B, and additional information for company C, as follows:
|
Company B |
Company C |
|
|
Total assets (same as operating capital) |
$400,000 |
$400,000 |
|
Bonds (12%) (same as net financial debt) |
200,000 |
300,000 |
|
Shareholders’ equity |
200,000 |
100,000 |
The only difference in financial structure is that company C has $300,000 of bonds and only $100,000 of shareholders’ equity. Its debt to shareholders’ equity ratio is 3:1 ($300,000/100,000) compared to company B’s debt to shareholders’ equity ratio of 1:1 ($200,000/200,000). Assume the same income from operations and income tax rate as our prior example in Figure 13.8. The partial income statements of each company would show:

Return on capital and return on shareholders’ equity would be calculated for each company as follows using the Scott formula:
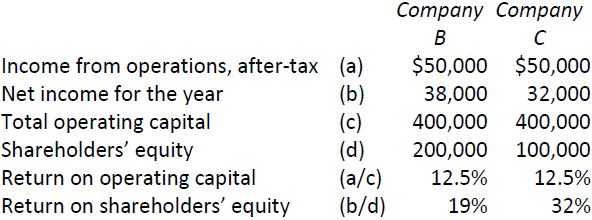
In each case, the companies have realized leverage on borrowed money. Bonds were issued at an after-tax interest rate of 6% and earned returns on operating capital of 12.5% for both companies, a difference of 6.5%. Why is company C’s return on shareholders’ equity 32%, and company B’s only 19%? The answer lies in the relative financial structure of the companies. In company B’s case, the debt to shareholders’ equity ratio is 1:1. Therefore each 6.5 cents earned on one dollar of financed assets (12.5 – 6%) is transferred to shareholders in proportion to the debt to shareholders’ equity ratio (1:1). In other words, company B’s return on shareholders’ equity is composed of a 12.5% return on assets plus a 6.5% return on leveraging, for a total return on shareholder’s equity of 19%.
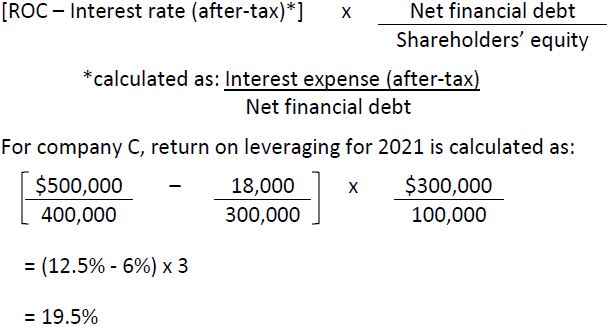
However, in company C’s case each 6.5 cents earned on one dollar of financed assets is increased because there are three dollars of debt for each dollar of shareholders’ equity. Therefore, the return on borrowed money to shareholders is magnified by this amount, or 6.5% x 3 = 19.5%. Company C’s return on shareholders’ equity is composed of a 12.5% return on assets plus a 19.5% return on leveraging, for a total return on shareholder’s equity of 32%.
Return on leveraging (ROL) is therefore determined as follows using the Scott formula:
- 2088 reads
