


When a vehicle is built, it contains parts purchased or produced by the original equipment manufacturer (OEM). When these parts need to be replaced, consumers often purchase after-market parts instead of OEM replacement parts because they may be cheaper or of better quality, and may enhance the performance or appearance of the vehicle. Acme Auto Parts Ltd. is an after-market automotive parts manufacturer established in 2010. It went public in 2014. The company’s headquarters are located in Oakville, Ontario. It has manufacturing plants in Oakville and four other Canadian and US locations. Each location is organized as a separate division. The company manufactures electrical components and provides parts to US and Canadian national retail chains that specialize in providing both sound advice and reliable parts to clients with higher-than-average disposable incomes, like car and truck hobbyists, as well as heavy truck fleet owners. It has several regional warehouses and divisional offices across Canada and the US. It has a reputation for producing high quality parts that are innovative, reliable, and efficient, and backing what it sells through a generous warranty and refund policy.
Acme has weathered a recent economic downturn well enough. Demand for its type of electrical auto parts has remained relatively strong. The company has two main competitors, both headquartered in the Far East. Though still ranked as the number one after-market electronic parts supplier in Canada in terms of total sales dollars and number four in the US, its competitors are slowly gaining ground. Acme is considered well-managed and is respected for the high quality of its electrical components. It does not compete by supplying a full range of after-market automotive products, but by identifying new niche markets for electrical components and leveraging its product line by continually searching for innovations in design and performance.
Acme has maintained very good relations with its suppliers and retail chains. These chains actively promote the brand as good value for money, and provide valuable feedback to Acme about retail customer purchasing trends and requests for new products. Unlike its competitors, the Acme sales force is well-trained to not only sell existing products, but to glean new ideas from customers and communicate these back to Acme management for consideration.
The company recognizes that long-term success largely depends on continued promotion of Acme products by these retail chains, which means that the chains must be able to continue to earn high gross profit on sales of these same products. However, increased competition from lower-priced electrical components produced by Acme’s Far East competitors has begun to cut into Acme’s sales and profit margins. In the past, Acme has relied on research and development and the North American patent process to maintain its market share. A few extremely successful product innovations were responsible for most of the past sales levels and profit margins. However, increased complexity of component design has created longer timelines to move new products from conception to production. Also, at least one of its competitor’s activities border on patent infringement, but legal remedies are costly, time-consuming, and often unsatisfactory.
Acme’s manufacturing facilities and processes are state-of-the-art. Once products have been successfully designed and tested, they are able to be manufactured very quickly and inexpensively, and in small batches. Acme’s distribution costs are lower than competitors because its manufacturing plants are closer to customers. In recent years, the threat of shortages of rare, very expensive metals used in the manufacture of many of its products has required the company to increase its raw materials inventories. Rapidly developing economies, particularly China, are demanding increasing amounts of these precious metals, and have begun to lock up supplies from African producers.
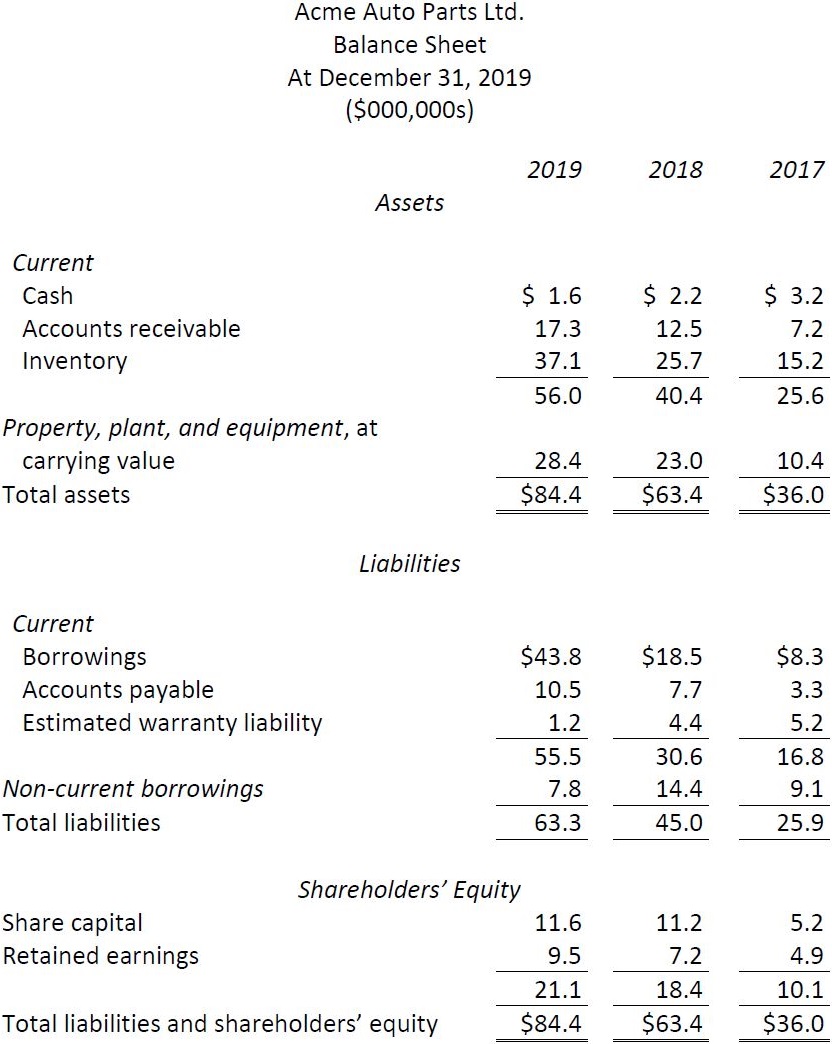
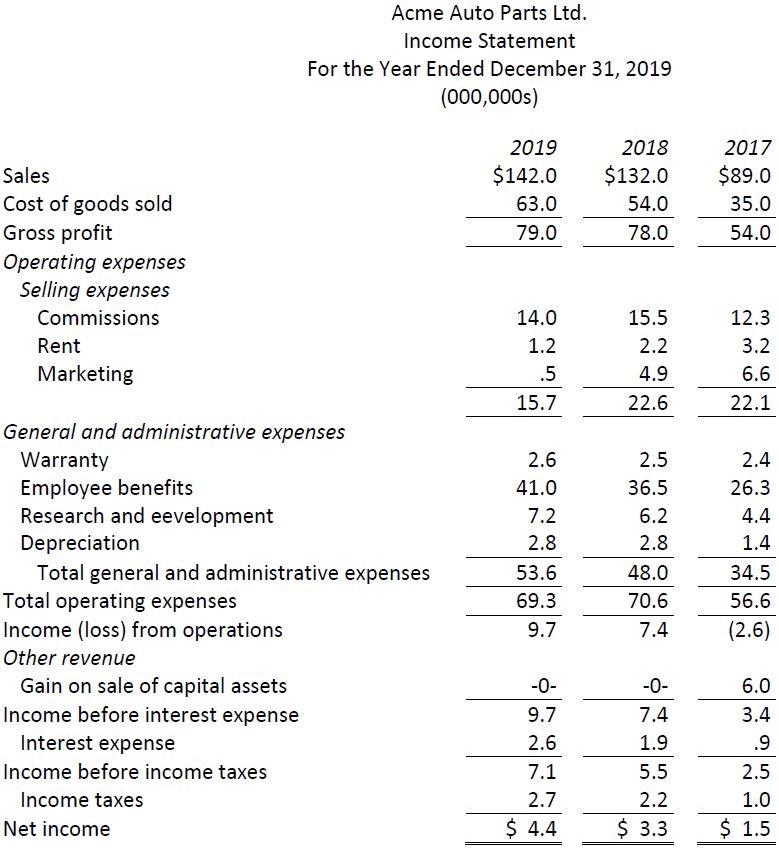
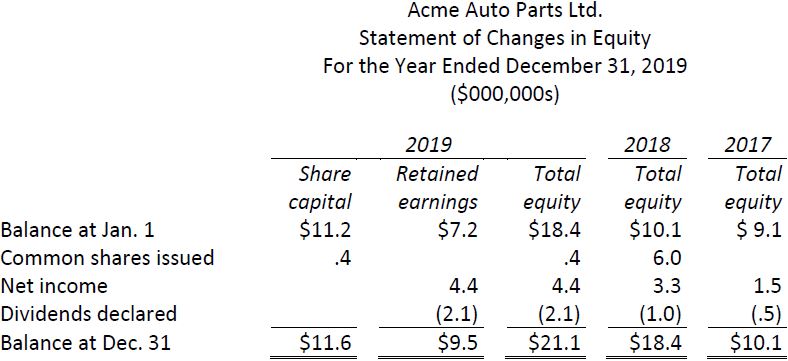
Financial statements for the three years ended December 31, 2019 are shown at the end of this problem, as well as financial ratios for the 2017 and 2018 fiscal years. Additional information gathered from the auditor’s report, management discussion and analysis, and notes to the financial statements indicated that:
|
1. |
All sales are on credit. |
|
|
2. |
In 2017, vacant land was sold for $11,000,000. No capital assets were sold in 2018 or 2019. |
|
|
3. |
Issued shares are composed entirely of common shares. Average number of shares outstanding was as follows: |
|
|
2017: 700,000 shares 2018: 1,100,000 shares 2019: 1,200,000 shares |
||
|
4. |
Average market price per share was as follows: |
|
|
2017: $32.52 2018: $55.50 2019: $73.40 |
||
|
5. |
Electronic fuel injectors are a significant portion of the company’s product line. Starting in mid-2018 until the problem was rectified near the end of 2019, a number of defective injectors were produced. As a result, warranty claims increased significantly during this period. |
|
|
6. |
Unlike the rest of the industry, the company depreciates tools, dies, and moulds over a two year period using an accelerated method. The rest of the industry generally depreciates these assets over a four-year period on a straight line basis. Acme’s investment in tools, dies, and moulds was significant during the period 2017-2019. |
|
|
7. |
Research and development has remained important to the company. On average, the industry spends about 2% of sales on R&D. |
|
|
8. |
There are no outstanding litigation issues, nor is management aware of any impending litigation. |
|
|
9. |
There are no operating leases for rented premises in place after 2019. |
|
|
10. |
The company’s auditor has issued unqualified audit reports each year. |
|
Required: Assume you are a loans officer with a large investment bank. Complete the 2019 financial ratio calculations below based on the financial statements at the end of this question, then analyze the results. Make a recommendation regarding Acme’s recent request for an additional $10 million long-term loan from your bank.
|
Acme Auto Parts Ltd. Selected Financial Ratios |
|||||
|
2019 |
2018 |
2017 |
2019 industry average |
||
|
a. |
Current ratio |
1.3 |
1.5 |
1.8 |
|
|
b. |
Acid-test ratio |
.48 |
.62 |
1.1 |
|
|
c. |
Accounts receivable collection period |
35 |
30 |
35 |
|
|
d. |
Number of days of sales in inventory |
140 |
135 |
122 |
|
|
e. |
Return on total assets |
14.9% |
(7.0%) |
18.0% |
|
|
f. |
Return on shareholders’ equity |
23.2% |
15.2% |
20.0% |
|
|
g. |
Times interest earned ratio |
3.9X |
(2.9)X |
5X |
|
|
h. |
Sales to total assets ratio |
2.7 |
2.6 |
1.5 |
|
|
i. |
Debt to shareholders’ equity ratio |
2.4 |
2.6 |
1.5 |
|
|
j. |
Gross profit ratio |
59.1% |
60.7% |
52.4% |
|
|
k. |
Net profit ratio |
2.5% |
1.7% |
2.1% |
|
|
l. |
Earnings per share |
$3.00 |
$2.14 |
$4.00 |
|
|
m. |
Price-earnings ratio |
18.5X |
15.2X |
21X |
|
- 1873 reads
