


Available under Creative Commons-NonCommercial-ShareAlike 4.0 International License.
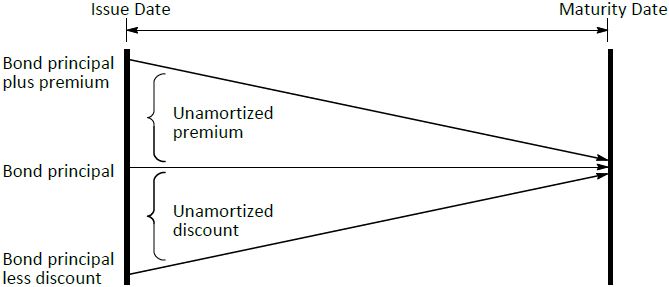
The following diagram shows how the carrying amount of bonds payable changes over time for bonds issued at a premium, at par, and at a discount.
Required:
- Explain the change in carrying amount of the bonds, in terms of the difference between the periodic interest expense recorded on the corporation’s income statement and the cash interest paid to investors.
- Does the diagram illustrate the straight-line or effective interest method of bond premium and discount amortization? How can you tell?
- 1834 reads
