Under the Scott Formula, return on operating capital is calculated as:

Based on the altered balance sheet and income statement of BDCC as shown in Figure 13.9 and Figure 13.10 above, the calculations of return on operating capital (ROC) for the three years are:
|
2021 |
2020 |
2019 |
||
|
Income from operations (after-tax) |
(a) |
$165 |
$151 |
$112 |
|
Operating capital |
(b) |
$2,000 |
$1,704 |
$1,061 |
|
Return on operating capital |
(a/b) |
8.3% |
8.9% |
10.6% |
Return on operating capital is significantly lower than the somewhat equivalent return on assets originally calculated earlier in this chapter (for example in 2021: 8.3% vs. 13%). This is primarily because income tax effects on income from operations are now considered, but also because the denominator is somewhat lower. Accounts payable and income taxes payable are now deducted from current assets to arrive at operating capital; cash and short-term investments are omitted.
Return on operating capital is analyzed further within the Scott formula. Two related ratios are calculated: the after-tax operatingprofit ratio, and the sales to operating capital ratio. These are somewhat similar to two ratios studied earlier in the chapter – the operating profit ratio and sales to total assets ratio, respectively. However, they are altered to incorporate changes to the balance sheet and income statement noted above. One other change is also made to simplify calculations: ending balance sheet amounts rather thanaverage are used.
The after-tax operating profit ratio for BDCC can be calculated as:

The sales to operating capital ratio is calculated as:

Notice that the product of these two ratios equals the return on operating capital ratio:

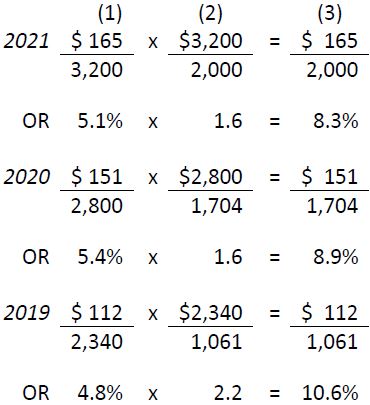
This relationship is used to provide further insights into the return on operating capital ratio. Using BDCC’s financial statement from Figure 13.9 and Figure 13.10, the ratios are calculated as:

The return on operating capital (column 3) has declined from 10.6% in 2019 to 8.3% in 2021. The after-tax operating profit ratio (column 1) has fluctuated somewhat over the same period. No trend is apparent. Therefore, the largest effect on ROC has been the decline in the sales to operating capital ratio (column 2) from 2.2 times in 2019 to 1.6 times in 2020 and 2021. This indicates that the increase in operating capital (chiefly assets like accounts receivable, inventory, and PPE) has not been matched with a proportionate increase in sales. This is similar to the conclusion reached earlier in the chapter. However, using the Scott formula, its direct effect on can now be calculated.
- 5481 reads


