


A price at which a common share trades on a stock market is perhaps the most important measure of a company’s financial performance. The market price of one share reflects the opinions of investors about a company’s future value compared to alternative investments.
The earnings performance of common shares is often expressed as a price-earnings (P/E) ratio. It is calculated as:

This ratio is used as an indicator of the market’s expectation of a company’s future performance. Assume Company A has a current market value of $15 per share and an EPS of $1 per share. It will have a P/E ratio of 15. If Company B has a market value of $4 per share and an EPS of $0.50 per share, it will have a P/E ratio of 8. This means that the stock market expects Company A to earn relatively more in the future than Company B. For every $1 of net income generated by Company A, investors are willing to invest $15. In comparison, for every $1 of net income generated by Company B, investors are willing to pay only $8. Investors perceive shares of Company A as more valuable because the company is expected to earn greater returns in the future than is Company B.
Assume that BDCC’s average market price per common share was $4 in 2019, $5 in 2020, and $6 in 2021. Its P/E ratio would be calculated as:
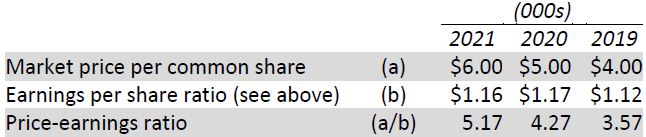
BDCC’s P/E ratio has increased each year. Although industry and competitor’s P/E ratio comparisons would be important to compare, BDCC’s increasingly positive ratio also indicates that investors are “bullish” on BDCC. That is, the stock market indicates that it expects BDCC to be increasingly profitable in the coming years. Despite a relatively constant EPS ratio from 2019 to 2021, investors are willing to pay more and more for the company’s common shares. This must be because future financial prospects are anticipated to be better than in the past three years.
- 1865 reads
